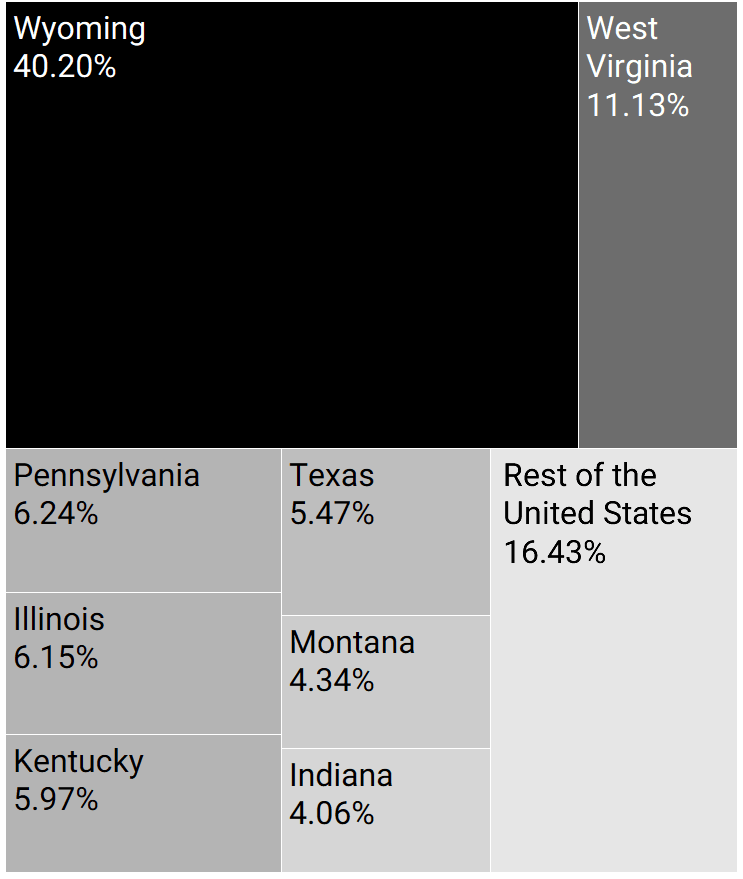
US Coal Production by State Q1-Q3 2016
 Last Update: 4/8/2017
Coal country may not be where you think it is. Shockingly West Virginia is a distant second place in coal production. Wyoming produces almost 4 times as much coal as West Virginia, with less than half as many full-time workers. Wyoming's miners produce at a rate of 27.4 tons of coal per employee hour versus West Virginia's 2.8 tons per employee hour (EIA PDF Report). That means that a miner in Wyoming produces almost 10 times as much coal per hour compared to a miner in West Virginia.
With the current low price of natural gas on top of the raw efficiency of Wyoming's mines, coal mining in Appalachia is an industry that may not be competitive or viable in the future. A recent op-ed in the New York Times titled Coal Country Is a State of Mind highlights the disparity between nostalgia for the past versus reality of today's economic market. Today, coal mining brings to mind dust-covered West Virginians wearing hard hats, but a more accurate image is of Wyoming's vast mechanized coal pits.
Coal Production Data Tables
Coal Production by State (Q1-Q3 2016)
#
State
Mined Tons (Q1-Q3 2016)
% of US Coal Mined
1 Wyoming 212,550 40.2% 2 West Virginia 58,838 11.13% 3 Pennsylvania 32,982 6.24% 4 Illinois 32,539 6.15% 5 Kentucky 31,552 5.97% 6 Texas 28,929 5.47% 7 Montana 22,938 4.34% 8 Indiana 21,471 4.06% 9 North Dakota 20,666 3.91% 10 Ohio 10,113 1.91% 11 Utah 10,074 1.91% 12 New Mexico 9,650 1.83% 13 Virginia 9,458 1.79% 14 Colorado 8,618 1.63% 15 Alabama 6,554 1.24% 16 Arizona 4,039 0.76% 17 Mississippi 2,119 0.4% 18 Louisiana 1,993 0.38% 19 Maryland 1,084 0.21% 20 Alaska 721 0.14% 21 Tennessee 534 0.1% 22 Oklahoma 473 0.09% 23 Missouri 174 0.03% 24 Arkansas 30 0.01% 25 Kansas 27 0.01% 26 Other 558 0.11%
Source: EIA Quarterly Coal Production 2016 YTD (Q1-Q3)
Tons of Coal Mined per Employee Hour (2015)
State
Tons per Employee Hour
Bar Graph
Wyoming 27.38 Montana 15.76 Kansas 12.26 North Dakota 11.79 New Mexico 8.55 Arizona 6.97 Texas 6.28 Illinois 6.09 Utah 5.66 Mississippi 5.59 Colorado 5.54 Louisiana 5.23 Alaska 4.62 Indiana 4.38 Pennsylvania 3.61 Ohio 3.59 Missouri 3.52 Kentucky 2.92 West Virginia 2.77 Maryland 2.56 Virginia 2.16 Oklahoma 1.84 Alabama 1.69 Tennessee 1.69 Arkansas 0.56
Source: EIA Annual Coal Production Statistics 2015
Copyright 2022 Statimetric
Coal country may not be where you think it is. Shockingly West Virginia is a distant second place in coal production. Wyoming produces almost 4 times as much coal as West Virginia, with less than half as many full-time workers. Wyoming's miners produce at a rate of 27.4 tons of coal per employee hour versus West Virginia's 2.8 tons per employee hour (EIA PDF Report). That means that a miner in Wyoming produces almost 10 times as much coal per hour compared to a miner in West Virginia.
With the current low price of natural gas on top of the raw efficiency of Wyoming's mines, coal mining in Appalachia is an industry that may not be competitive or viable in the future. A recent op-ed in the New York Times titled Coal Country Is a State of Mind highlights the disparity between nostalgia for the past versus reality of today's economic market. Today, coal mining brings to mind dust-covered West Virginians wearing hard hats, but a more accurate image is of Wyoming's vast mechanized coal pits.
With the current low price of natural gas on top of the raw efficiency of Wyoming's mines, coal mining in Appalachia is an industry that may not be competitive or viable in the future. A recent op-ed in the New York Times titled Coal Country Is a State of Mind highlights the disparity between nostalgia for the past versus reality of today's economic market. Today, coal mining brings to mind dust-covered West Virginians wearing hard hats, but a more accurate image is of Wyoming's vast mechanized coal pits.
Copyright 2022 Statimetric